

 Previous page
(Mg,Fe)O is the second most abundant mineral in the Earth's lower mantle, coexisting with (Mg,Fe)SiO3 perovskite. Knowledge of the elastic properties in this solid solution is crucial for interpreting lower mantle seismic data in terms of bulk mineralogy.
Fe-bearing periclase is opaque, so optical measurements of the acoustic
velocity such as Brillouin scattering are difficult to perform. Therefore,
we performed a series of bench-top ultrasonic experiments on six synthetic
single crystals of (Mg,Fe)O with Fe contents ranging from Fe/(Fe+Mg) =
0 to Fe/(Fe+Mg) = 0.75 and on Fe1-xO end member (x=0.062). The
(Mg,Fe)O samples were synthesised at 1450°C and 10-7 atm
oxygen fugacity. The Fe-content in each sample was determined by electron
microprobe analysis at several points to ensure chemical homogeneity. The
crystal thicknesses - determined visually with a high power microscope
- range from 250 to 700 µm parallel to [100], and their orientation
was verified by X-ray diffraction to be within 0.5° of the measured
direction. Travel time data were collected in the 300-500 MHz frequency
range. The velocity v is calculated by v = 2•l/t, with l sample thickness and t travel time. Sound wave velocity is
related to the elastic modulus through the equation  • v2=c11, with
density, v sound wave velocity and c11 elastic modulus. The
density of the different samples is inferred
from lattice parameters measured by single crystal X-ray diffraction utilising
the 8-reflection centering routine.
• v2=c11, with
density, v sound wave velocity and c11 elastic modulus. The
density of the different samples is inferred
from lattice parameters measured by single crystal X-ray diffraction utilising
the 8-reflection centering routine.
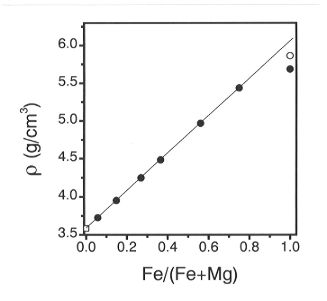
Figure 3.1-3 depicts the X-ray density as a function of Fe-content.
The error bars in and Fe/(Fe+Mg) are smaller
than the symbols. All the data except non-stoichiometric Fe0.938O
give a linear trend of density versus Fe-content. The lower density for
Fe0.938 O presumably reflects the presence of about 6.2 atom%
cation vacancies. If we recalculate this density by adjusting the mass
so that all Fe-sites are occupied and correct the volume using extrapolation
of the lattice constant data as a function of non-stoichiometry, we obtain
a 'stoichiometric' density for FeO of 5.863 g/cm3. This value
is shown as the open circle in Fig. 3.1-3. This 'stoichiometric' density
is in reasonable agreement with the extrapolated trend on densities for
samples with lower Fe-content.
 |
|
Fig. 3.1-3: Density of (Mg, Fe)O as a function of Fe-content. The
open circle represents the corrected stoichiometric' density of FeO. Error
bars are within the symbols.
|
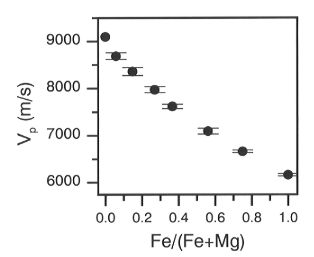
Figure 3.1-4a depicts the sound wave velocity vp as a function of Fe-content. While the error bars in vp include the uncertainties in both thickness and travel time measurements, they are dominated by the accuracy in thickness determination. The MgO end member value was taken from Jackson and Niesler .
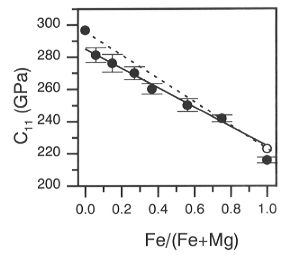
Figure 3.1-4b shows the elastic modulus c11=
• v2. The error bars in c11
include uncertainties in both the velocity and the density determination.
The hollow circle represents the 'stoichiometric' FeO using the recalculated
density. It is possible to fit a linear curve to the data points (solid
line) except for the periclase value, which varies significantly from this
trend. It can be seen that a simple linear interpolation of the data between
the end-members periclase and wüstite, shown by the dotted line in
Fig. 3.1-4b, deviates from our data.
We are currently performing experiments on (Mg,Fe)O of various compositions
at higher pressures to determine the variation of the elastic properties
with depth in the Earth.
 |
 |
|
Fig. 3.1-4a: Longitudinal sound wave velocity of (Mg,Fe) O as a function
of Fe-content.
|
Fig. 3.1-4b: The elastic modulus c11 of (Mg,Fe)O as a function
of Fe-content. The open circle represents the elastic modulus for the corrected
'stoichiometric' wüstite, the solid line is a linear fit through the
(Mg,Fe)O data points, the dotted line is a linear interpolation between
the two end-members.
|

Tel: +49-(0) 921 55 3700 / 3766, Fax: +49-(0) 921 55 3769, E-mail: bayerisches.geoinstitut(at)uni-bayreuth.de