
Experimental investigations of element partitioning between coexisting melt and aqueous fluid often employ bulk analytical techniques coupled with chemical and/or mechanical separation to determine the composition of one or both phases. A more direct approach entails in situ microanalysis of quenched glass and fluid inclusions, representing the melt and fluid phases, respectively. Accordingly, we have used the LA-ICP-MS technique to determine fluid:melt partitioning in haplogranitic melts at high pressures and temperatures.
Starting materials were haplogranitic glass powders doped with 1000 ppm of Nb, Mo, Cs, and W, and a 5 wt% NaCl aqueous solution. Experiments were conducted in rapid-quench cold seal vessels at 850°C and 200 MPa. Analyses were performed using an ELAN 6000/Perkin Elmer ICP-MS in combination with a 193 nm ArF excimer laser at the Institut für Isotopengeologie und Mineralische Rohstoffe, ETH Zürich. For external calibration of the glass we used NIST SRM 610 glass; standard solutions were used to calibrate the fluid inclusion analyses. Si, determined by microprobe, and Cl, calculated from microthermometric measurements, served as internal standards for the glass and the inclusions, respectively.
A major question concerns the matrix correction necessary to separate
the contributions of the fluid inclusion and host to the inclusion signal
intensity. If the concentration of an element is much smaller in the inclusion
than in the glass, then its signal structure can be used to correct the
signal intensities of all other elements as long as no elemental fractionation
occurs during the laser ablation. Despite their different solubilities,
Al, Si and Nb show similar signal structures in the spectra during ablation
of the inclusion. This illustrates the matrix effect contribution to the
fluid inclusion signal. We apply a correction to the intensity of the inclusion
signal based on Si. Glass analyses show a reproducibility of up to 10%
for the major elements Na and K; the trace elements vary up to 13%, with
the exception of Mo at 21%. In comparison, the fluid inclusion analyses
show relative standard deviation values for Na and K up to 25% and 20%
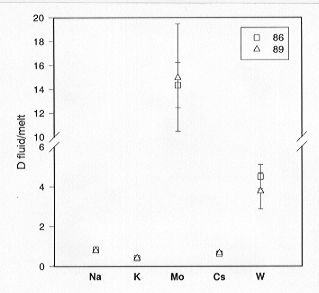
for the trace elements. Partition coefficients are given in Fig. 3.8-10.
 |

Tel: +49-(0) 921 55 3700 / 3766, Fax: +49-(0) 921 55 3769, E-mail: bayerisches.geoinstitut(at)uni-bayreuth.de
 Previous page